The Henry Fund is an endowed equity portfolio managed by select Master of Science in Finance students at the University of Iowa’s Tippie College of Business. The Fund targets US-traded companies that are industry leaders with above-average investment potential.
The 2024 Management Team
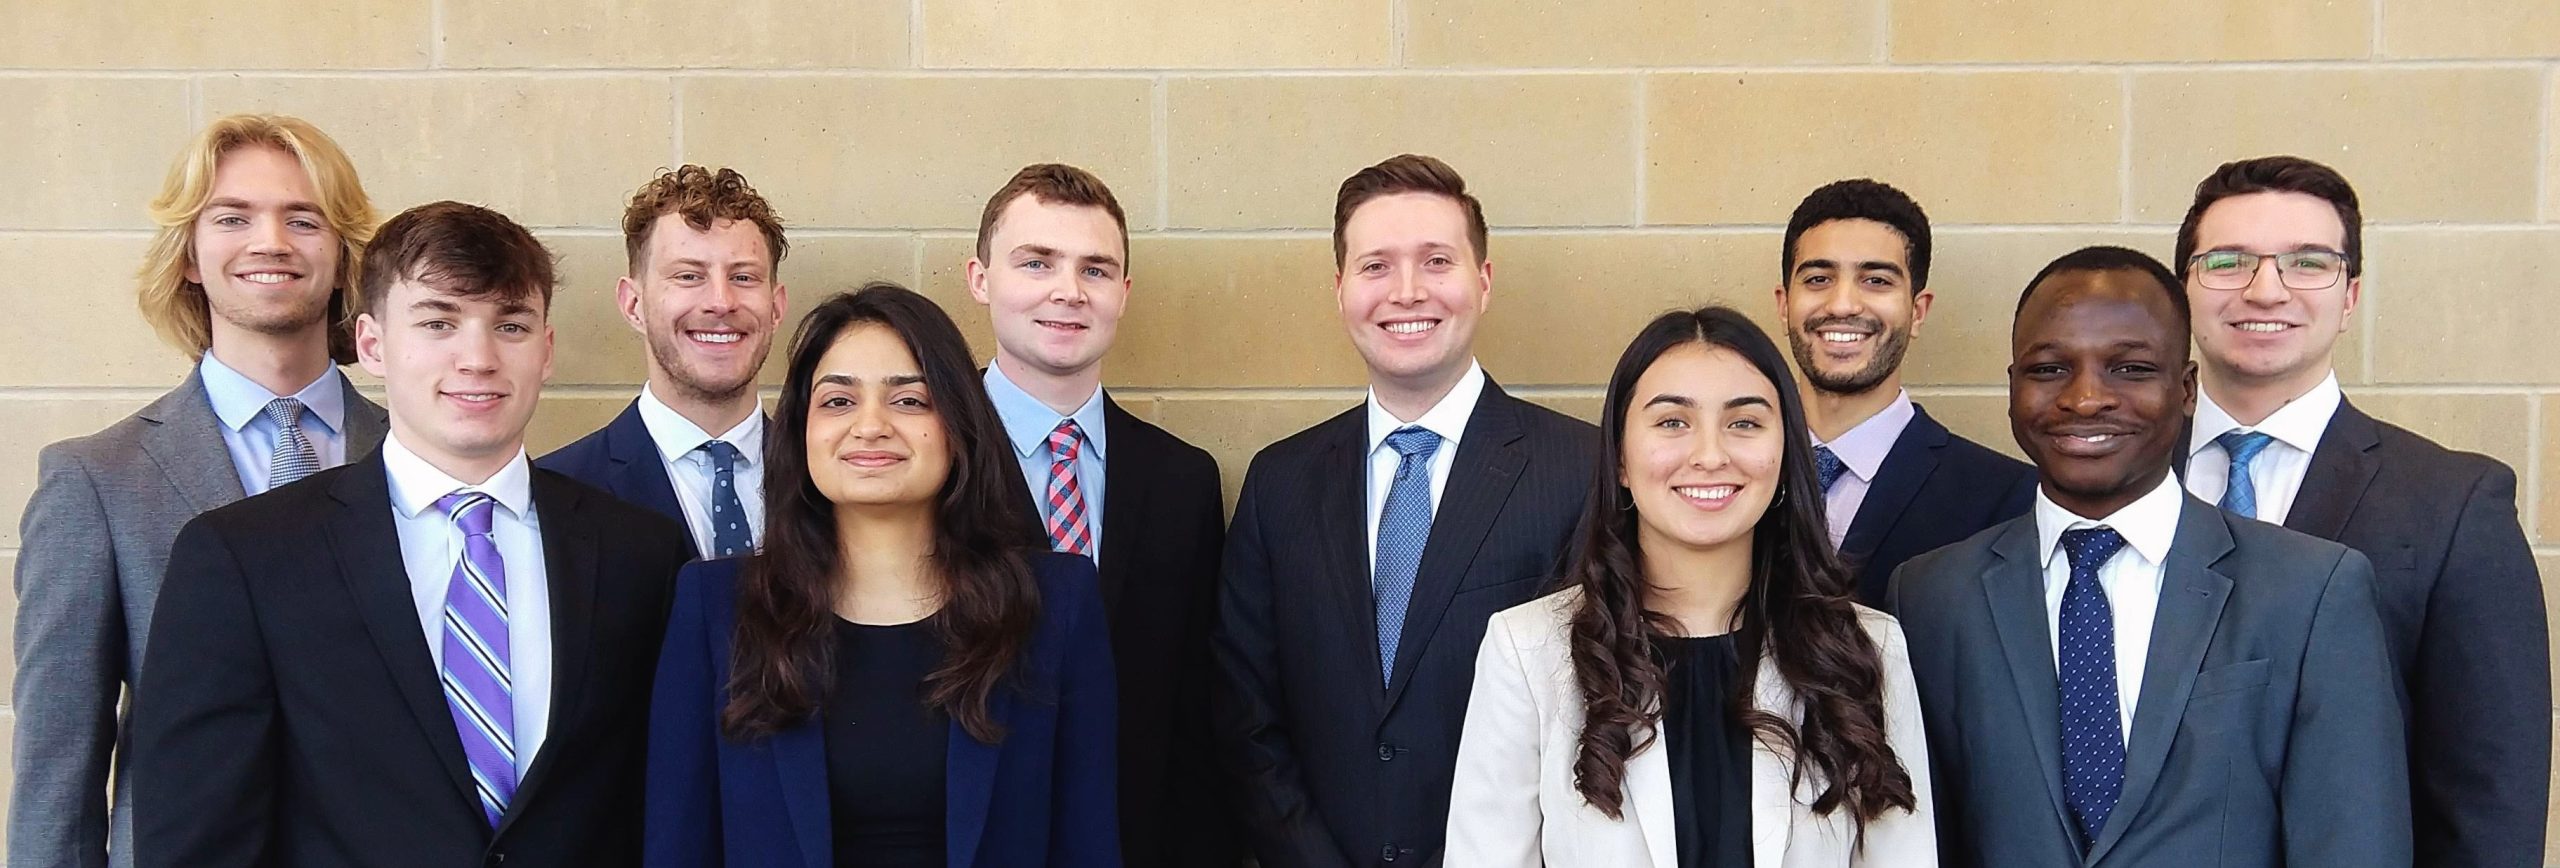
Front row (left to right): Jared Chmelka, Sarah Wig, Valentina Espinosa, Abdulqudus Opeloyeru. Back row: Charlie Pattinson, Michael Scheldrup, Caleb Tammen, Nick Pittman, Omar Amin, Carter Turbett.
Each analyst specializes in one or more economic sectors. Team members analyze current holdings, identify potential opportunities, implement control systems, and monitor the Fund’s performance. Analysts also deliver semi-annual presentations to an independent advisory board of financial professionals, which oversees all investment decisions.